Trends & Export
Dashboard
The start page shows one tile per portal with the main figure for the selected month (e.g. seats, devices, users, amount) and a sparkline of its development. Clicking the tile opens the drilldown: the portal’s composition by customers and metrics.
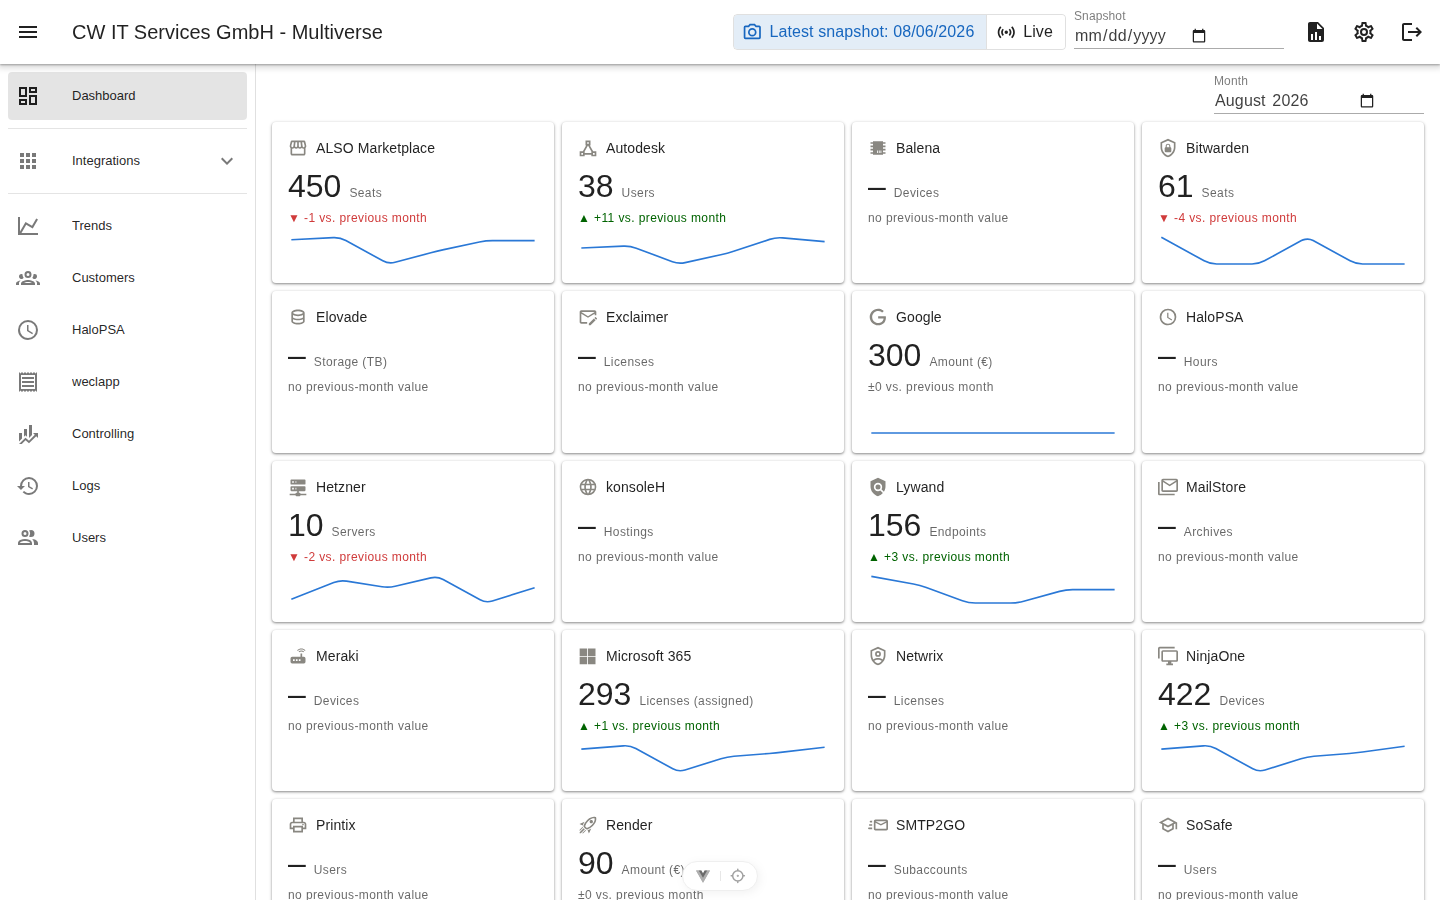
Non-unit values (Azure consumption, storage expansions) are deliberately excluded from the tile totals so that seat counts are not distorted.
Trends
The trends view charts the development per portal, customer, and metric over freely selectable periods (day/week/month/year).
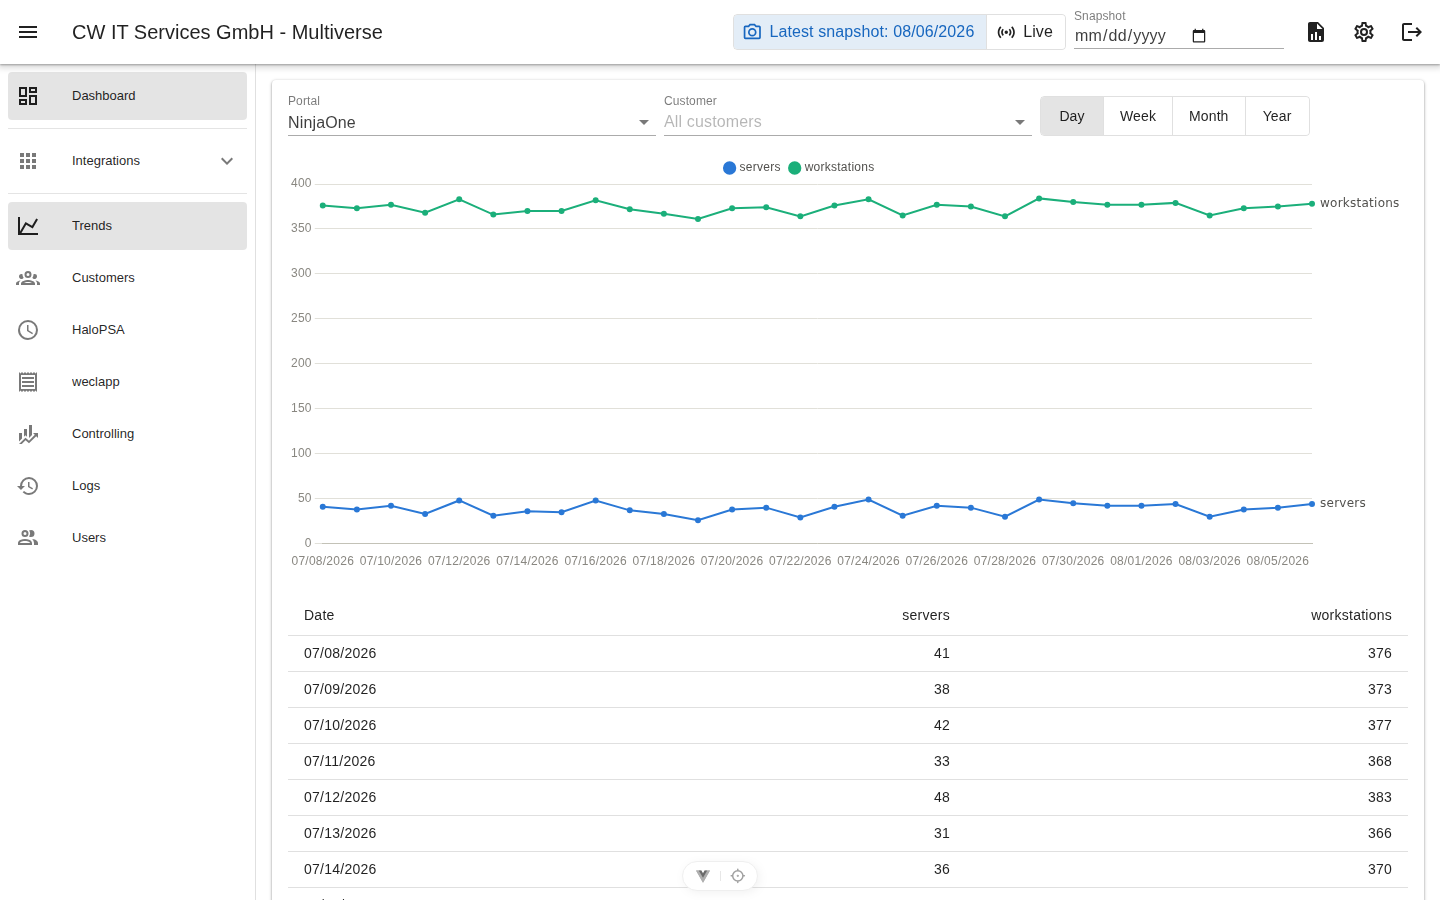
Typical questions that trends answer:
- Is a customer growing or shrinking in Microsoft licenses?
- Since when has this Azure consumption been getting out of hand?
- How are our managed servers developing overall?
CSV export
Monthly export (dashboard)
The export dialog on the dashboard generates a CSV with the snapshot figures — filtered by period, customer, and service (portal or category, e.g. “ALSO Seats/Licenses” vs. “ALSO Usage”).
- Values rounded to at most 2 decimal places, amounts month-accurate.
- UTF-8 with BOM — umlauts come out right when opening directly in Excel.
- Ideal for tax advisors, controlling, or ad-hoc analyses; for the actual invoicing there is the invoice run.
Per integration
Every integration view has an “Export CSV” button on the right above its table. It exports the currently displayed state (snapshot or live) of exactly that integration. In the dialog, the following applies everywhere:
- Columns selectable — all columns by default; optionally restrict.
- Customers selectable — an empty selection exports all customers; optionally pick individual customers.
- Sorted alphabetically by customer, values rounded to 2 decimal places, UTF-8 with BOM. File name
<portal>_YYYY-MM-DD.csv.
For the snapshot portals (Hetzner, NinjaOne, Veeam, Bitwarden, Autodesk, Balena, the € portals, …), each metric gets its own column (e.g. Server/Backups/IPv4 for Hetzner). The specialized views export exactly their respective table or the active tab:
- ALSO — in snapshot mode customer × product (one quantity column per product), live the company directory.
- Microsoft 365 — the tenant licenses (Customer, Sold, Assigned, Available) or, in the “ALSO comparison” tab, the deviations.
- Meraki — per organization: devices, models, license status/editions, expiry, and unused inventory.
- HaloPSA — depending on the tab, the individual time entries (date, customer, ticket, billing type, agent, hours) or the monthly totals per customer.
- weclapp — the generated PRE-invoices (customer, no., period, billing, net/gross, created, link).
All integrations at once (Settings → Export)
The global Settings (gear) contain the “Export” category. It exports all integrations at once — here you only pick the customer (multi-select, empty = all customers); the columns are always all of them per integration.
- Each integration produces its own
<portal>_YYYY-MM-DD.csv— the same naming as the individual exports — bundled into a ZIPexport_YYYY-MM-DD.zipfor download. - What is exported is the latest snapshot of each integration. Integrations without a snapshot — or without matches for the selected customers — are skipped.
- Each metric gets its own column (customer plus all metrics), sorted alphabetically by customer, values rounded to 2 decimal places, UTF-8 with BOM.
The controlling view additionally has its own CSV export for its core tables (margin per product and customer).